I use Google Analytics for the majority of websites that I work on. It can though be a hugely daunting prospect – the amount of information available is huge, and getting to grips with what of it is useful, and what can safely be ignored, can be challenging.
So, I tend to do 3 things straight away: create a couple of custom dashboards, set up weekly emails for the one or two main reports I want to look at, and create some basic goals for the website – enabling me to benchmark progress and identify website problems with achieving those goals.
I’m going to walk through the 3 custom dashboards that I set up straight away – and deal with the reports in another post next week.
Custom Dashboards in Google Analytics
What is a custom dashboard? Well, by default, when you log on to Google Analytics, it shows you some core, basic information about the traffic on your website over the past month. That’s fine – and, depending on how yours is set up, it might include things like a graph of visits / unique visits, a map of visits, visitor browsers, etc. Basic stuff.
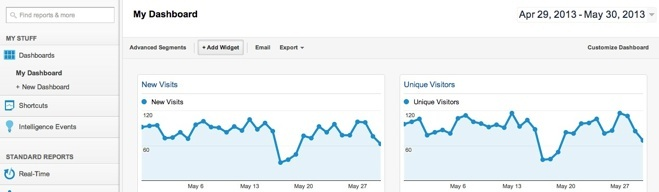
On the left hand side of the page, there’s a link to create a ‘New Dashboard’ – if I click that, I can then use a simple interface to add new items to the dashboard. Helpfully, there is also the ability to import dashboards created by others into your own set up. That’s brilliant – and that’s all I do to add these 3 dashboards straight away:
Site Performance Dashboard
The ‘Site Performance‘ dashboard contains great information like the average page load time, the average server response time, page load time by browser … geeky stuff like that, but in high volume situations, this can be really insightful. (If your call to action is at the bottom of a page that takes too long to load, it might not be any wonder that it doesn’t perform very well for you!)
You can add the Site Performance dashboard to your analytics account by clicking the link.
SEO Dashboard
Then, I like to gather all the pertinent SEO information into one place by using the SEO dashboard. This was put together by Koozai.com and is a great way to review the headline information regarding SEO performance.
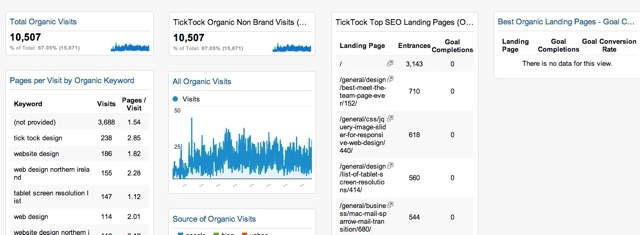
I particularly like being able to see the top landing pages and the number of pages per visit by keyword. So, if someone ends up on my site by searching for Northern Ireland Web Design, I can see how many pages they’re likely to visit, as opposed to those who find me by searching for ‘ticktockdesign‘
Realtime Overview
Not one I use all the time – my site is reasonably low volume, but for some clients it proves invaluable (particularly if they are prolific bloggers or content marketers). A ‘real time’ dashboard is exactly that – a dashboard of activity happening on your website right now.
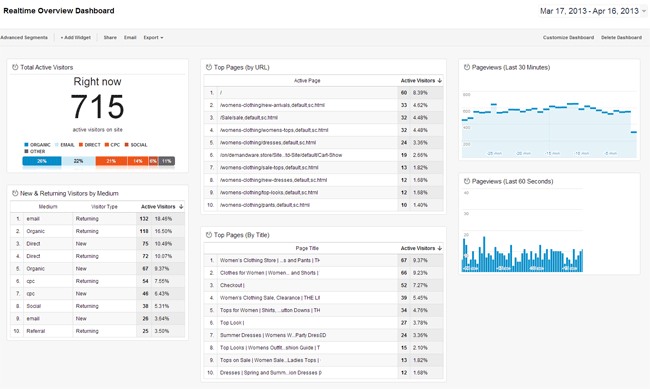
This realtime overview dashboard was put together by Dan Barker and it’s great. In the blink of an eye you can see exactly how many people are on the site, what pages they’re visiting, and whether they’re new or returning visitors. All good stuff.
Hopefully that was useful … will follow it up shortly with setting up regular email reports!